|
|
Lower-Surface Split Oil-Flow Images With and Without 12mm Tape (10/1/2011)
10/1/2011
On 10/1/2011, I tried to take oil-flow visualizations with side beside examples of the clean and taped lower-surface leading edge, using
Tesa 4104, 12mm, White tape. Such split oil-flow images catch the two leading edge treatments under identical conditions.
The procedure was flawed, however, by two factors. First, I applied the oil too near the leading edge, so that it tripped the flow, leading to streaming of the oil all the way to the trailing edge without a normal transition from laminar to tubulant flow with a classic bubble. The other problem was that by the time I launched, it was afternoon and there was a lot of turbulence, making it impossible to hold a constant airspeed. This tends to tubulate the flow and smears the features in the oil from leading to trailing edge. Nevertheless, sufficient change appears to have occurred in the taped zones to indicate effectiveness even in turbulent air. Better images will be taken later.
Figs. 1 and 2 show an oil swath at 12.75 ft (3.9 m) from the wing root before and after the flight, respectively. I attempted to hold 65 kts, but was not able to maintain it consistently.

Figure 1. 12.75 ft (3.9 m) Span Station Before 65 kt Flight
|

Figure 2. 12.75 ft (3.9 m) Span Station After 65 kt Flight
|
The first thing to note is the generally softer appearance of a large region of the oil on the right side of Fig. 2, downstream of the tape. The left edge of the tape is marked in black. These soft areas show the oil mostly undisturbed from the original patterns left by the brush strokes as shown in Fig. 1. The region begins between zones B and C, marked in yellow, and extends as far back as zone E. This is far beyond the extend of the normal transition bubble for the speeds flown. See Figs. 3 and 4 below, which show the bubble position and extent for 60 kts and 70 kts.
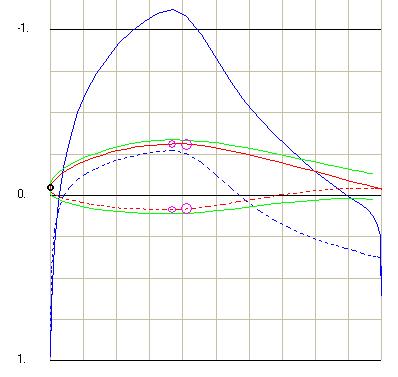
Figure 3. Simulated Position of Transition Bubbles at 60 kts
|
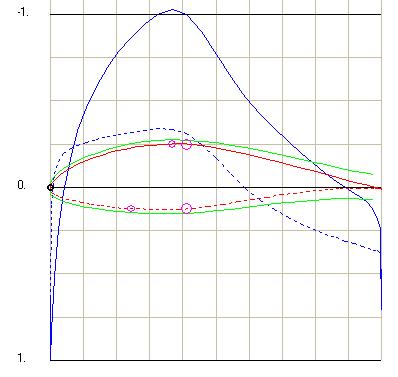
Figure 4. Simulated Position of Transition Bubbles at 70 kts
|
In zone A, the oil is being dragged aft by the flow, until it rises above the surface too far to pull the oil along with it. In zone B, it becomes clearly detached. This stands in contrast with the untaped side of the swath. Except for one trail of turbulent attached flow, started by three specks of debris (click to expand the image), the flow is essentially off the surface in zone C. The region between zones B and C shows horizontal light lines in the oil, possible indicating the forward part of a gentle reverse flow where it encounters the aft flow picking it up to form a very wide, flat circulation bubble. The light regioin at the rear of zone C is where the flow descended back onto the surface. Comparing this to the pre-flight image makes it clear that the lightness was caused by the flow, not the original application of the oil. A normal reattachment behind a bubble occurs at a fairly steep angle and tends to scrub the oil off the surface more than Fig. 2 shows. This implies a grazing reattachment angle and a very much flattened residual bubble. Fig. 5 shows a normal pattern with the bubble region obviously indicated. It should be noted that the transition bubble on the bottom of a Wortman airfoil moves forward and widenes with increasing speed and backward with reduced speeds. This smears the oil patterns when the airspeed is allowed to swing, as occurred in the present flight.
It is noteworthy, that even in undesirable conditions for testing, the taped region of the wing obviously appears to have worked metter than the untaped region. This indicates that at least some of the positive effects from the tape continue to work in the turbulence of normal soaring flight.
Finally notice the uniform region of attached flow at the rear of the wing in zone E. This is a greatly reduced area compared to the untaped side of the swatch. As mentioned, the oil, being applied so close to the leading edge, may be tripping the flow causing the entire left side os the swatch to be covered with attached turbulent flow. there should be detachment of the laminar flow, a bubble circulation region that collects oil, a light zone where reattachment occurs and attached turbulent flow from there back.
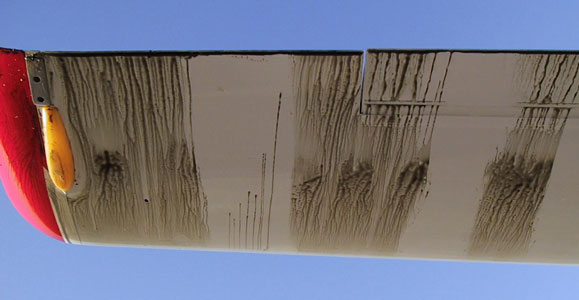
Figure 5. Normal Lower-Surface Transition bubble Near Wing Tip
|
Figs. 6 and 7 show an oil swath at 20.8 ft (6.4 m) from the wing root before and after the flight, respectively. Zone A of Fig. 7 shows a very obvious smooth, square shaped region behind the tape that worked well. the horizontally oriented waves in zone B are clear evidence of gentle forward flow encountering the aftward flow that lifts it away from the surface. The rear part of zone A shows a very gentle reattachment with very little lightening of the oil where the turbulence begins to form. Zone C on the left, where there is not tape, also shows smooth oil. This is a region where the oil was not applied too close to the leading edge and did not trip the flow. This evidences a weak bubble that is normal so far out near the wing tip. It may be argued that zone A is nothing but the same. But, zone A is wider, in the streamwise direction. and is in a region where the oil is too close to the leading edge.

Figure 6. 20.8 ft (6.4 m) Span Station Before 65 kt Flight
|

Figure 7. 20.8 ft (6.4 m) Span Station After 65 kt Flight
|
11/4/2011
On 11/4/2011, additional oil-flow images were taken with swaths split between taped and bare lower-surface leading edges.
Although the air was smooth, the quality of the images was not as good as hoped. Nevertheless, the oil swath located 12 feet
from the wing root contains several clues. Areas of interest in Fig. 9 are bracketed with yellow lines and labeled A-E. In both images
the leading edge is at the top. For this flight, the relative humidity was about 70% and the temperature was 51º F (10.6º C).
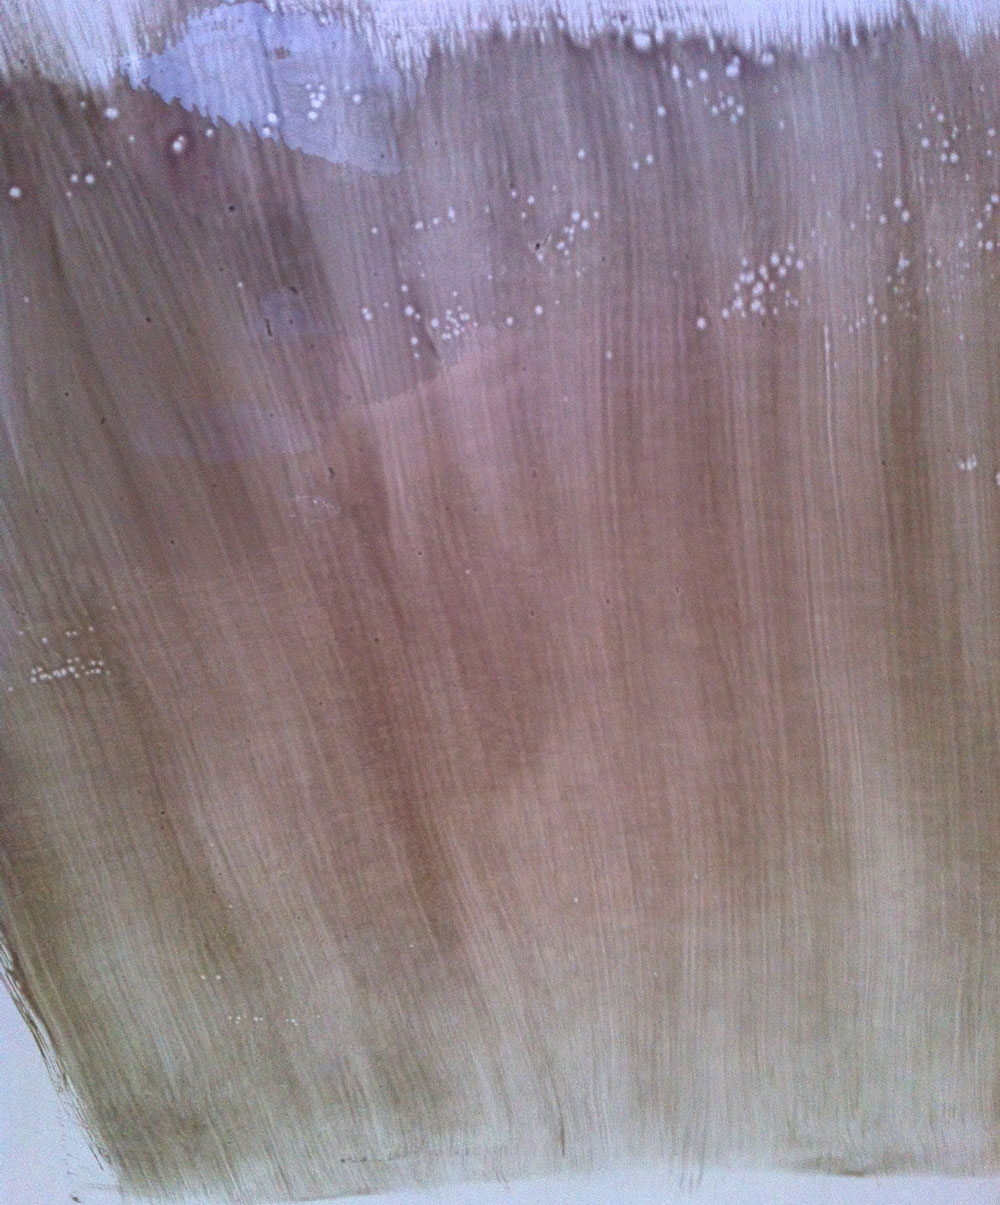
Figure 8. 12" (3.66m) Span Station Before 70kt Flight
|
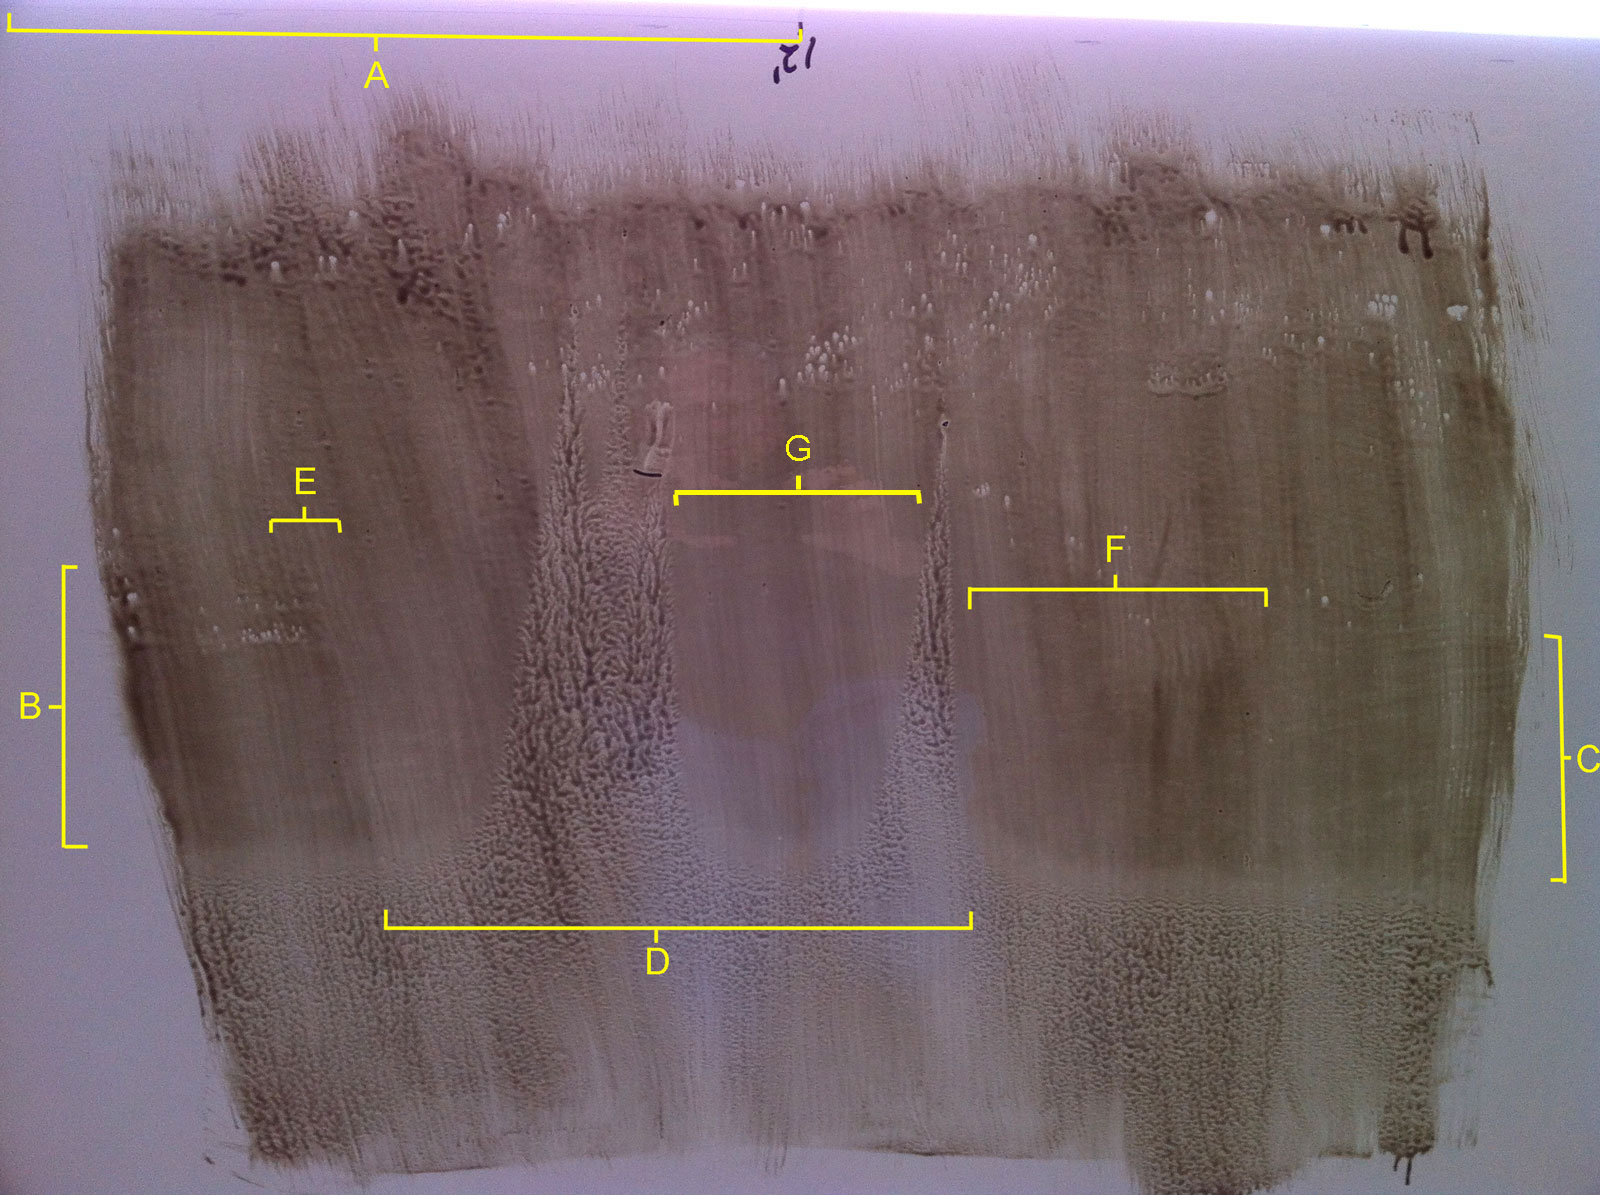
Figure 9. 12' (3.66m) Span Station After 70kt Flight
|
A indicates the location of the tape. B and C highlight regions of darker oil that define the presence of circulation bubbles. The light band at the bottom of these regions is the reattachment line where the reattaching flow tends to wipe the oil from the surface. The reattachment line on the left side, behind the tape, is noticeably closer to the leading edge than the one on the right side, where the leading edge is clean.
Below, down stream from, the reattachment line, the blotched streams of oil indicate attached turbulent flow. Additional areas of turbulent attached flow appear as wedges that start hear the top of the image. These were triggered by debris that became stuck in the oil during takeoff from the grass runway. The wide one on the left started at three points and merged into one wide stream of turbulent attached flow. the norrow one on the right illustrates the turbulence that just one speck of debris can cause. Although these marred the image, they did not totally destroy it's usefulness.
In a circulation bubble, as in zones B and C, the flow on the surface moves backward, from trailing to leading edge, and is much slower than the detached flow over the top of the bubble. The circulation traps oil, not allowing it to stream aft past the reattachment line. The oil in these zones becomes smooth and soft looking, revealing only the original brush strokes. An obvious difference between the bubbles at B, behind the taped leading edge, and C behind the clean leading edge, is that one is wider and farther forward than the other. Clearly, the the tape has the effect of flattening and widening the bubble, and moving it forward.
It is interesting that the inside end of the bubble at C,where it is truncated by a narrow wedge of turbulent attached flow, narrows to a bullet nose in region F. This is because it is necessary for the hight of the bubble to come down as it approaches the attached flow at the left end of F. And, as the hight decreases, so too must the width.
The bubble at B, behind the tape, also appears to end in a bullet nose, but it is harder to see because the oil on that region, on the right side of E, was applied lighter than on the left side. Nevertheless, the general smoothness of the bubble zone can be seen between E and the wide turbulent stream. And, it can be seen that it ends in a blunt bullet nose shape.
Region G, between the streams of turbulent flow, shows no indication of a bubble, only the original brush strokes all the way back to the reattachment line, which is farther forward than on the right side. This appears to be a region where the tape flattened the bubble almost entirely.
Although, the quality of this oil-flow visualization is lacking, it nevertheless shows indications of the tape working. This is seen in the forward relocaation and widening of the bubble behind the tape, and an absence of a bubble indication in region G. In contrast, on the right side, where the leading edge of the wing is clean, the bubble is consistently narrower, and presumably higher, and is located farther aft.