|
Background
In 2003, when we began flight testing Dr. Sinha's deturbulator drag reduction device,
we anticipated that, if it worked, acceptance would be hard to achieve.
A key element in our plan was to obtain independent verification at the earliest possible date.
Since Dick Johnson has perhaps more experience testing sailplanes
(gliders) than anyone in the world and
is known around the world for his uncompromising flight test evaluations, we asked him to do
the job. He agreed.
Two years later, we finally got my glider (Standard Cirrus, #60, 1970, N2866, QZ) to him.
On 12/13/2006, at Caddo Mills, Texas, Dick and Jeff Baird logged four high altitude
test flights in QZ with modified wings using the 2nd prototype of
Dr. Sinha's deturbulator tape which had been installed nearly a year earlier. The next day,
they flew two more flights. At that point, Dick felt that he had enough data for
a clear measurement of performance. The wings were then cleaned to
restore them to standard condition. Then on 12/23/2006 they flew three additional flights to
measure the unmodified (baseline) performance. Additional flights also were taken to calibrate
the airspeed system.
I had logged our best two flights
on 9/27/2006 and 10/21/2006 that yielded optimistic results indicating more than 20% improvement at best L/D
speed. These flights encouraged us to take QZ to Dick Johnson immediately rather than
delay another year. As reported earlier, we have not yet implemented solutions to our performance
consistency (stability) issue, so this was a risky decision. Our purpose, however, was
not to present a market-ready product but merely to demonstrate the potential of Dr. Sinha's invention.
It should be said that Dr. Sinha and I took sparse data points (airspeed intervals of 10 and even 20 kts)
because we were looking only for information to assist in configuring the deturbulator tapes on the wings.
With limited resources of time, funding, towing altitude and towing opportunities, this was necessary.
The plan was to convince ourselves that we were close to the best practical configuration and then have the
glider tested properly and independently for a good look at what we had.
Now we have Dick's data, taken at 5 kt intervals, and we see that it reveals information we would
like to have had sooner.
Six test flights
Following are graphs showing the altitude profile (Figs. 1-6), sink rate (Figs. 1a-6a) and
glide ratio (Figs. 1b-6b) for each of the six test flights at Caddo Mills. Flights 1-4 were on
12/13/2006 and 5-6 the next day. Each sink rate graph shows a 2nd order
polynomial fit to the data and the unmodified performance of the glider (baseline).
The altitude profiles (Figs. 1-6) were taken from an on-board Cambridge 302 flight data recorder.
In these figures, the blue data are GPS altitudes and the red are pressure altitudes.
Data were taken using Dick's time honored method of noting, for each speed,
the start time, ending time, start altitude and ending altitude. These were normally taken
over a 400 foot drop in altitude, long enough to average out small perturbations in vertical air movement.
Points that were dropped from my formal analysis (below) are shown in black. Curious features
in the sink rate graphs (Figs. 1a-6a) are highlighted with blue connecting lines.
(click image to enlarge)
| Deturbulated-Wing Flight Tests - 12/13/2007 - Day 1 |
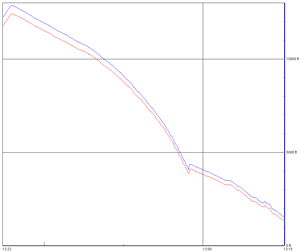 Figure 1. Flight 1 Altitude vs. Time
|
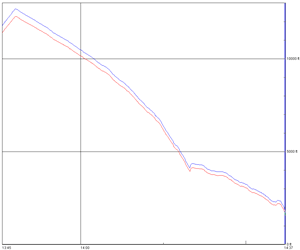 Figure 2. Flight 2 Altitude vs. Time
|
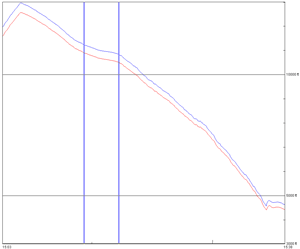 Figure 3. Flight 3 Altitude vs. Time
|
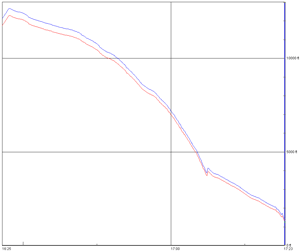 Figure 4. Flight 4a Altitude vs. Time
|
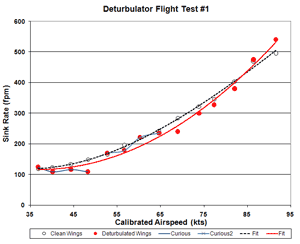 Figure 1a. Flight 1 Sink Rate
|
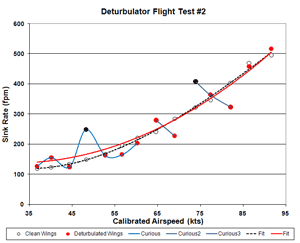 Figure 2a. Flight 2 Sink Rate
|
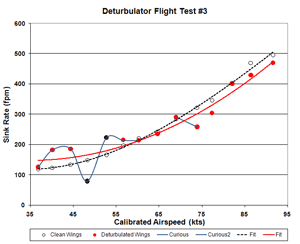 Figure 3a. Flight 3 Sink Rate
|
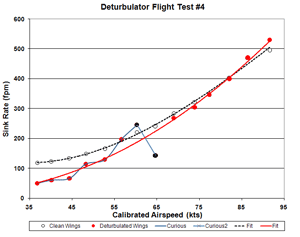 Figure 4a. Flight 4 Sink Rate
|
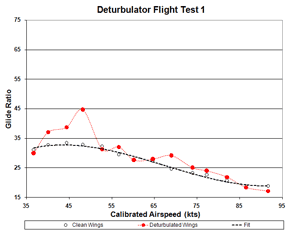 Figure 1b. Flight 1 Glide Ratio
|
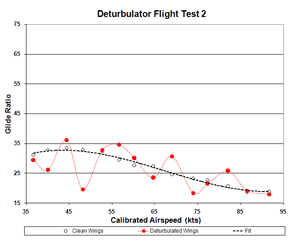 Figure 2b. Flight 2 Glide Ratio
|
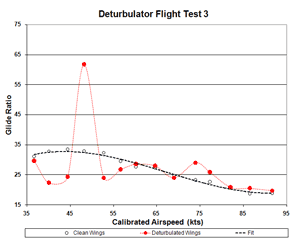 Figure 3b. Flight 3 Glide Ratio
|
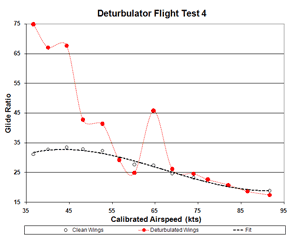 Figure 4b. Flight 4 Glide Ratio
|
| Deturbulated-Wing Flight Tests - 12/14/2007 - Day 2 |
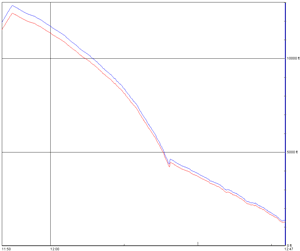 Figure 5. Flight 5a Altitude vs. Time
|
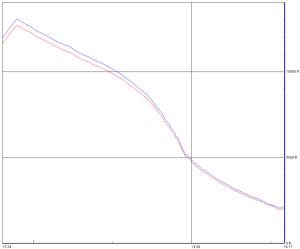 Figure 6. Flight 6a Altitude vs. Time
|
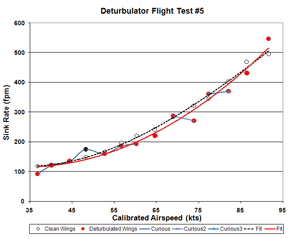 Figure 5a. Flight 5 Sink Rate
|
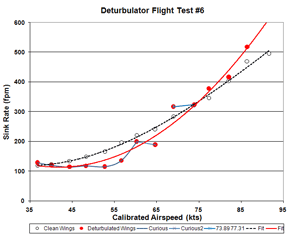 Figure 6a. Flight 6 Sink Rate
|
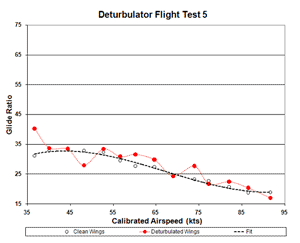 Figure 5b. Flight 5 Glide Ratio
|
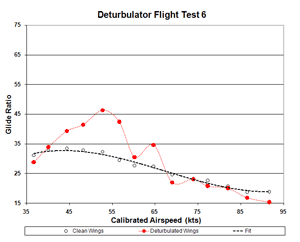 Figure 6b. Flight 6 Glide Ratio
|
Three clean-wing flights
Following are the Johnson data for the three clean wing (baseline) flights. These were averaged to arrive at the
clean wing curves in Figs. 1-6 (above). These flights are shown individually here to make the point that the extremely
large deviations from baseline seen in Figs. 1-6 are far beyond normal data scatter from atmospheric convection,
as seen in these Figs. 201-203 (below). There is no accounting for those large deviations, except as a result of
the deturbulator tapes applied to the wings.
| Clean-Wing Flight Tests - 12/21/2007 |
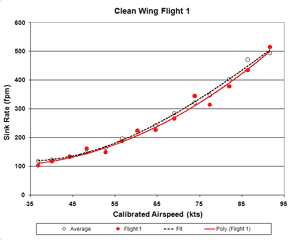 Figure 201a. Clean-Wing Flight 1 Sink Rate
|
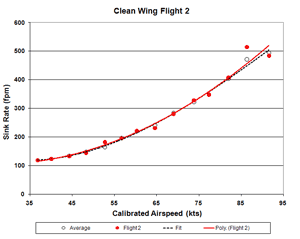 Figure 202a. Clean-Wing Flight 2 Sink Rate
|
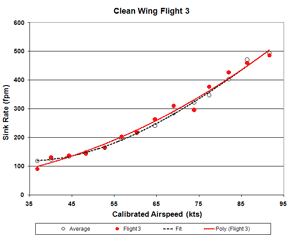 Figure 203a. Clean-Wing Flight 3 Sink Rate
|
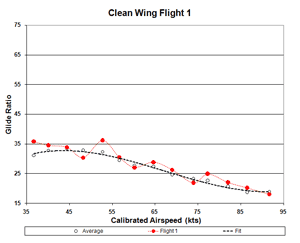 Figure 201b. Clean-Wing Flight 1 Glide Ratio
|
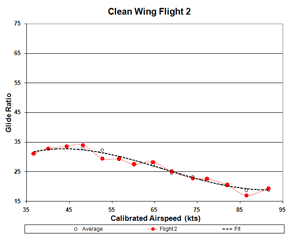 Figure 202b. Clean-Wing Flight 2 Glide Ratio
|
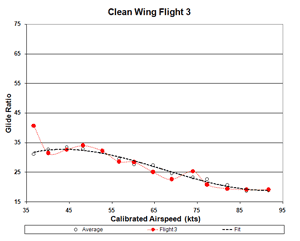 Figure 203b. Clean-Wing Flight 3 Glide Ratio
|
Statistical Analysis
A statistical analysis of the Caddo Mills data will be posted here in the near future.
Dynamic Wings
To properly interpret the data from these flight tests, it is necessary to understand that Johnson was testing,
for lack of a better term, dynamic wings!
By that, I mean that the aerodynamic properties of the wings were changing dynamically in flight.
Of course consistency, repeatability, is the goal and is necessary for a successful commercial product.
But, at this early stage of development, it is enough to show the amazingly large performance enhancements
that are possible using the Sinha deturbulation methods. Consistency will come in due time.
To appreciate that the wing aerodynamics were in fact changing dynamically, consider that
we are attempting to make the boundary flow follow the suction-side wing without
exerting any appreciable shear forces on the wing surface from leading to trailing edge. The key element
in the method is the deturbulator device that uses a thin (.00025 inch) Mylar film (skin), stretched
over tiny ridges, to interact with the flow where it is attempting to reattach to the surface.
It should be clear, that the Mylar must lie on the surface precisely for this
to work optimally. If it puffs up by excessive pressure below the skin, it will flutter and create
turbulence and skin friction. If it is pressed down into the ridges by excessive
pressure, it will behave like a solid piece of tape and, because, of it's location
on the wing, produce baseline performance. Both behaviors are seen clearly in these data.
Obviously, there is a need to ventilate beneath the Mylar skin so that static pressure
changes do not disturb the contact between the skin and the ridges. If the vents are not
responsive enough, then performance will suffer. Moisture, leading to condensation under the
skin is a major contributor to vent blockage and performance changes.
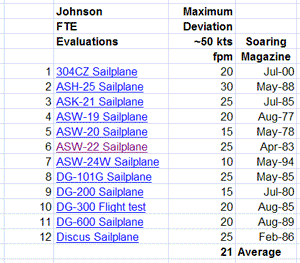 Figure 27. Maximum Sink-Rate Deviations
near 50 kts in 12 Johnson FTEs
|
Clearly, this suggests that the skin must be precisely controlled at all times if consistent performance
is to be achieved. Not surprisingly, we were not doing that very well with the prototype deturbulators
that Johnson tested. So, one must expect significant performance changes not only between flights,
but even within individual flights, and that too appears in the data.
So, to see the true potential of deturbulation, it is necessary to inspect individual flights. With the right
resources of aircraft and manpower, we could have taken data relatively free of influences from
convection in the air by flying in parallel with a glider of known performance. But we had to do what we
could with what we had. That meant taking sink rate measurements along with the scatter and bias
from turbulence, waves and air-mass movement. Johnson, likewise, took sink rate measurements. However, the
effects we are looking for, and indeed see, are so large that they can easily be distinguished from
atmospheric aberrations.
To make this point, consider that Johnson has been measuring glider sink rates for nearly 50 years. A sampling of his
earlier flight test evaluations (Fig. 27) indicates a normal flight-to-flight maximum deviation in sink rates of
21 fpm in the critical 50 kt speed range, which is consistent with the scatter in the three baseline flights
in this test series (Figs. 201-203 above). But, in these Johnson tests half of the flights produced deviations
between 75 and 100 fpm, four to five times normal! One should not quickly dismiss these as normal scatter
from air movement, or think that Johnson has lost his touch for picking good testing days. Patterns in the data
(below) will make that clear.
A "rigid wing" mentality is sure to miss all that's important and historical in the data taken at Caddo Mills
in December of 2006. The wings of that Standard Cirrus were dynamically morphing their appearance to the
air. This is easily seen in the greatly varied, and sometimes weird, polar shapes of the individual flights
(Figs. 1-6). Again, nothing remotely like this can be seen in earlier Johnson data, except when flaps
were changed. But, of course, a Standard Cirrus has no flaps.
If you can accept this, then you can see that averaging sink rate data over individual flights, to reduce the
scatter, will also average down the very-real variations in deturbulator performance. Nevertheless,
there is so much there, that averaging even as many as six flights yields an impressive 13-18%
improvement according to the Johnson report. But the real truth can only be seen by looking at individual flights.
|
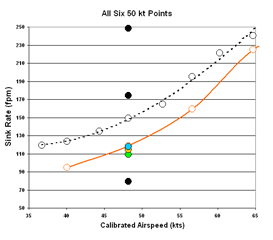
Figure 31. 50 kt Sink Rate Measurements
|
|
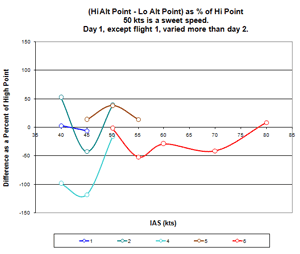
Figure 32. Duplicate Measurements
as Percent Change
|
|
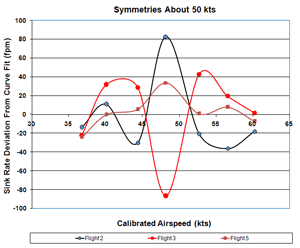
Figure 33. Deviation from Curve Fit
Symmetries About 50 kts
|
Something awfully good
On December 21, I received a brief message from Dick:
”Something awfully good appears to be happening rather consistently at 60[sic] kts.
I wonder what it is?”
In his analysis, Dick averaged all of the flights, as he normally does, and found a persistent point at
50 kts indicating 13% improvement. He then dropped flights 2-4 from his analysis because of "scatter" in the data.
This yielded 18%.
However, close scrutiny of the dropped flights, considering that we are looking not at a rigid wing,
but one with compliant surfaces that dynamically interact with the flow, reveals some curious
patterns. Some of these are highlighted in Figs. 2-6 (above) with blue lines.
Notice that all of the dropped points are associated with these patterns in the data.
My selection criteria dropped three of the six measurements at 50 kts, the airspeed Dr. Sinha targeted for
best performance. No other airspeed lost more than one point. Not surprisingly, the 50 kt airspeed yields
the greatest performance changes and is the least consistent speed and appears to exhibit a behaviors
resembling resonances.
The symmetry around the 50 kt point in flights 2, 3 and 5 (Fig 33) suggests that these patterns are not random scatter
from air movement. Furthermore, the magnitude of the deviations at 50 kts, suggests that a strong dynamic process is
operating. The "polarity" reversal in flights 2 and 3, in the 35-65 kt airspeed band, suggests
that the process is highly sensitive and is capable of producing performance that is either unbelievably good
or very bad by the same magnitudes. In fairness, it should be noted that four of the six data points at 50 kts,
indicate (Fig 31) significantly improved performance as does overall averages of flights. Further study of this
remarkable phenomenon may show ways to control this behavior and broaden the speed range where it occurs.
Fig. 31 shows all six measurements at 50 kts, together with the baseline (black) and the average of our
two best prior flights
(orange). Points dropped from this analysis are colored black. The clustering of the three accepted points
(blue, gold and green), in contrast to the three dropped points, seems to justify the selection criteria
used in the formal analysis below.
However, symmetry in the low airspeed range of flights 2 and 3 suggests that those 50 kt points are real too.
Of particular interest is the point in flight three where Dick measured 79.1 fpm.
The conspicuous bend in the altitude profile (Fig. 3) looks as if Dick flew into the up side of a shear wave.
But, how likely was it that Dick and Jeff would see only one such event in 96 measurements that day?
Furthermore, this happens to be the airspeed for which Dr. Sinha tuned the deturbulators for best performance.
Finally, the blue lines in Fig. 3 show that this event began and ended
with the start and finish of the 50 kt speed run (10,900 ft and 10,500 ft pressure altitudes).
The precise coincidence cannot easily be ignored.
Fig. 32 shows a comparison of the duplicate data points, that Dick and Jeff took at low altitude, to their
high-altitude counterparts. A positive value indicates that the lower altitude measurement shows a lower sink rate.
Notice that in all four flights that duplicated the 50 kt point, performance improved at low altitude.
This further suggests that there is a dynamic process working in a special way at 50 kts.
Another pattern in these data is the numbers of large magnitude high-low sink rate crossovers at high speeds.
Flights 2 and 5 show higher than normal sink at 50 kts with symmetry around that point. They also show
two high speed crossovers. Flights 3, 4 and 6 show greatly improved low speed performance and only
a single crossover. I highlighted a second almost-crossover in flight 6 and there might possibly be a
third one between 80 and 85 kts. However, the low speed performance in flight 6 is was odd, with a
flat sink rate from 35 to 55 kts. I have no comment regarding the low speed end of flight 5.
For the reasons stated above, we should at least consider the possibility that Dick caught the deturbulators at a rare
moment when everything was perfect (Static pressures above and below the skin were precisely right and
skin tension was perfect for ideal contact with the substrate ridges. And, the critical
points in the boundary flow were centered precisely over the deturbulator strips.) and the deturbulators
demonstrated what they are capable of doing.
The problem is that in flight 3, 79.1 fpm sink rate at 48.1 kts (calibrated) implies an unbelievable 61:1 L/D ratio.
Before dismissing this out of hand, we should ask "assuming the conditions that deturbulation is intended to achieve,
will Nature allow this for a Standard Cirrus at 707 lbs?" An imaginary, perfectly deturbulated wing would
(1) effectively have inviscid flow over the entire top surface and (2) have dynamically changing effective
top-side camber that could increase CL for even better performance.
A second aircraft has now been equipped with deturbulators, Greg Cole's personal SparrowHawk. Testing should
commence soon and Dick Johnson is eager to flight test that one too. Greg tells me that his calculation on the
SparrowHawk, assuming top-side inviscid flow, but no effective camber change, indicates 52:1.
Tabulation of Patterns
Looked at individually, the six flight polars (Figs. 1-6) show extraordinary variations, making it hard to
believe that they came from the same aircraft. As noted before, variations of this magnitude
should not be dismissed offhand as scatter from air movement. Furthermore, as one studies these
polars, patterns begin to emerge. Following are some obvious ones:
| Pattern |
Flights |
Comments |
| Symmetry around 50 kt peak |
2, 3, 5 |
Resonance-like behavior.
Sensitivity to small speed changes.
Shows extremes of performance potential.
Flight 5 is a weak repetition of flight 2.
See Fig. 33 above.
|
| Asymmetric low/high performance crossovers |
2, 3, 4, 5, 6 |
Resemble phase swaps.
One when 50 kt performance is good.
Two when 50 kt performance is bad.
|
| Flat sink rate at low speed end |
1, 4, 6 |
Recovery from vent lag on tow complicated by humidity. |
| Return to baseline at mid-speeds |
1, 2, 3, 4, 5, 6 |
Always present.
Sometimes holds baseline for 3-4 speed points. (Fig. 25)
Implies deturbulator skin pressed into substrate.
|
| Performance surge after mid-speed baseline |
1, 2, 3, 4, 5, 6 |
Always present.
Implies release of pressure deturbulator skin.
|
| General performance improvement with successive flights each day |
1, 2, 3, 4
5, 6 |
Day 1:
Flight 1 - benign good
Flight 2 - very bad 50 kt, 70 and 85 kt bad/good crossovers
Flight 3 - very good 50 kt, all good high speeds
Flight 4 - unbelievably good except mid-speed crossover
Day 2:
Flight 1 - benign mixed
Flight 2 - very good low speed
Suggests humidity purging with successive flights.
Suggests 50 kt symmetrical performance extremes in mid-day flights 2 & 3
are transitional behaviors as deturbulators dried out, leading to ultimate
performance in flight 4.
|
It is important to realize that the performance deficiencies seen in these six
flights derive from flaws in the prototype deturbulators that were tested, not from
fundamental issues in the Sinha method. On average, even these early prototypes, produced remarkable
results, as indicated by Dick Johnson when he averaged all six flights for a 13% performance
improvement. The good news is that the problems with the early prototypes are well understood and
design improvements are being tested. All that remains is to settle on the best materials and design for
consistent performance and to automate the manufacturing for acceptable quality control and better economy (pricing).
The Sinha boundary flow control method is a remarkable achievement that promises large
efficiency gains wherever gases (perhaps liquids too) flow over curved surfaces. It is certain to
become a practical and commonplace device in the near future. The benefits are too great for this not to happen.
Selecting data points
For this analysis, data points were dropped that deviated more than 23% from the 2nd order
polynomial fit. The intent was to use reasonable,
objective criteria to drop as few points as possible in order to achieve the most accurate information.
The choice of a 23% threshold was determined by trial and error. Larger values included
points that were clearly out of line with other flights and smaller values eliminated
points that were clearly witnessed by other flights.
Only seven points (black in Figs. 1-6) were dropped from this analysis.
It should be pointed out that other Caddo Mills data points were discarded from this analysis. These were
points taken a second time, at low altitude, after having been taken at high altitude. Justification for this
is implied by recognition in Dick's report of a loss of performance improvement at high speeds (low altitudes in the test runs)
due to inadequate pressure equalization above and beneath the deturbulator skin. This makes these additional
points suspect. Furthermore, without them the Caddo Mills data correspond almost
perfectly with prior data (Fig. 25), confirming the correctness of not using them. The convergence at 50 kts of all
three curves in Fig. 25 (below) is not coincidental.
Averaging all six flights
If you assume that the deturbulator is stable under all conditions of temperature, humidity and altitude change, then
you may consider all variations in the data to be random scatter and you may simply average all six flights for
the truest picture of performance. This yields Figs. 7-9 below. This assumption is not true, however, as we
have reported previously. Nevertheless, this method will yield a minimum performance improvement that is
impressive. Notice that the L/D point at 50 kts is over 40:1. The 4th order curve fit to the data
does not pick this up. Is it real?
The orange curve is an average of my two best flights (9/27/2006 and 10/21/2006). It is included here and below
to help judge the extent to which the Caddo Mills flights corroborate our best measurements. The orange data points
are sparse so the connecting curve should not be taken as particularly meaningful.
A 4th order polynomial fit to the data indicates 15% better maximum L/D ratio (Fig. 8).
That is a considerable performance improvement and more than adequate to verify that Sinha
deturbulators are very effective indeed.
However, a close look at Fig. 8 reveals that the 50 kt point (41:1 glide ratio)
falls directly over the same point on the orange curve, from two nearly identical prior flights.
(Click the image for a better look.) Notice that the red line (4th order fit
to the data) is hardly influenced by this high point.
This 41:1 point is well established in the Caddo Mills data by four flights and by an two
additional flights in Arkansas. Six points are normally more than enough to smooth data
even under poor conditions. A huge residual error would be needed push it so far above the curve.
So, I conclude that this point is real and the L/D curve should run through it!
The best L/D improvement indicated by these data is actually 25%.
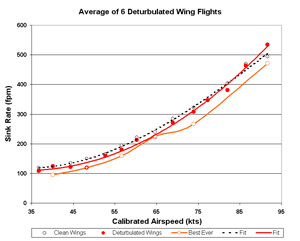 Figure 7. Six Flights Sink Rate
|
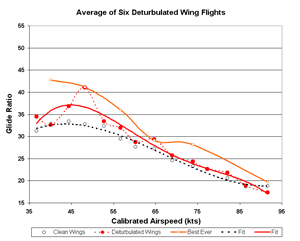 Figure 8. Six Flights Glide Ratio
|
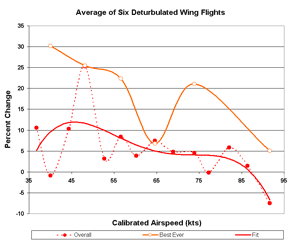 Figure 9. Six Flights Percent Change
|
Averaging flights 1, 5 and 6
Looking at the excessive "scatter" in the 2nd, 3rd and 4th flights,
Dick thought that a better picture might be obtained by averaging only
the 1st, 5th and 6th flights. This yields a little improvement
at 55, 60 and 70 kts.
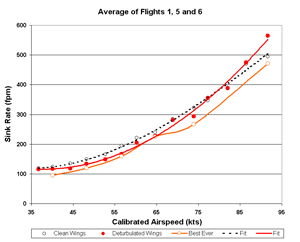 Figure 10. Flights 1. 5 and 6 Sink Rate
|
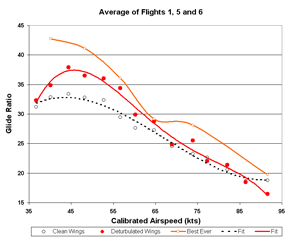 Figure 11. Flights 1. 5 and 6 Glide Ratio
|
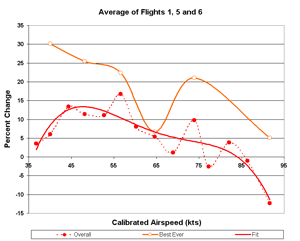 Figure 12. Flights 1. 5 and 6 Percent Change
|
Averaging flights 1 and 6
Throwing out the 5th flight too makes a large difference and moves the 50-65 kt
points to values that are consistent with our best two flights. That's interesting and perhaps meaningful,
but too much data are ignored to consider it seriously. Nevertheless, the results are shown in Figs. 13-15.
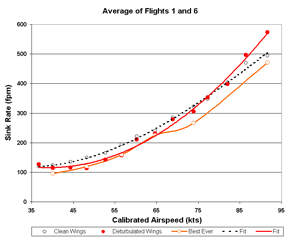 Figure 13. Flights 1 and 6 Sink Rate
|
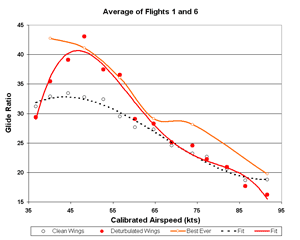 Figure 14. Flights 1 and 6 Glide Ratio
|
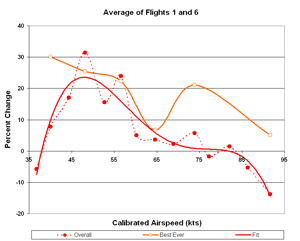 Figure 15. Flights 1 and 6 Percent Change
|
Averaging flights 4 and 6 only
An interesting exercise is to average the best flight from each day in the Caddo Mills test series.
They would be flights 4 by Jeff Baird on day 1 and 5 by Dick Johnson on day 2.
The results, in Figs. 16-18 below, seem impossible.
Nevertheless, let's give this a little consideration.
Here are the positive points:
- This is not a single flight, but an average of two flights.
- There is very little scatter in the critical speed range below 60 kts.
- The data are corroborated closely by two prior flights.
- Four data sets is often sufficient for reasonably good results.
- Glide ratios around 45:1 are claimed for modern 15 meter gliders.
Here are the negatives:
- A 45:1 glide ratio in a 36 year old 15 meter glider is very hard to believe.
- Four data sets may not enough to be truly convincing.
- The low speed performance in flight 4 (Fig. 4a) clearly is not possible.
- Perhaps you can think of others.
Although, 35 and 40 kt performance improvements were not seen in this test series,
improvements at 40 kts have been measured consistently in prior flights (six
presented in an the report
Itís Deturbulation Time Again
plus our best two flights (orange in the figures on this page).
Accounting for this discrepancy is not difficult in light of ventilation issues mentioned in the Johnson report.
At Caddo Mills, tests were run over a much greater range of altitudes than previously in Arkansas.
This and greater humidity levels offer a convincing explanation.
The low speed performance in flight 4 is aberrant and it may be only a coincidence that averaging
it with flight 6 produces low speed performance nearly identical to our best two prior flights.
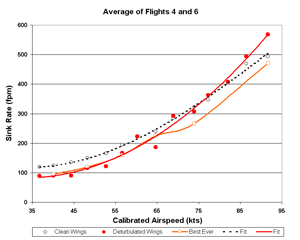 Figure 16. Flights 4 and 6 Sink Rates
|
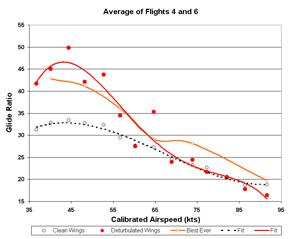 Figure 17. Flights 4 and 6 Glide Ratio
|
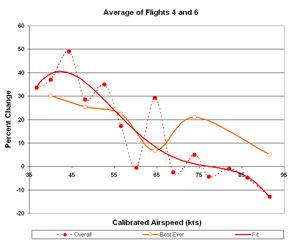 Figure 18. Flights 4 and 6 Percent Change
|
Separating days 1 and 2
Let's assume that the present (2nd prototype) deturbulator
does in fact vary considerably in it's operation with changes in temperature, humidity and altitude.
This has been adequately documented in earlier progress reports both by data and anecdotal evidence like
changing pitch attitudes and trim settings.
This kind of instability should be expected, considering the delicate balance we are attempting to achieve
and the early development state we are in. (There is more than a little humor in fact that our present deturbulators
quit in the best soaring weather and come to life in the worst.)
If one can accept that the method works at all, as the Caddo Mills data clearly confirms,
then the miracle is that any kind of stability can be achieved at all, not that it fails.
The good news is that we think we can account for all of the foibles of the present deturbulator in its construction
features. They are not caused by the flow-surface interaction that makes deturbulation work. I fully
expect the 3rd prototype to overcome most or all of the problems.
Given that performance varies from flight to flight or even within a flight, averaging data from different
days, or even different times in the same day, usually removes not only scatter and bias in the data
but also the performance we are trying to see. So, it makes sense to average data taken at nearly the same time and
place, or on different occasions when atmospheric conditions are similar or patterns in the data are similar
(as in our two best previous flights).
Figs. 19-21 show an average of the four flights logged on day 1 at Caddo Mills separately from the two flights on
day 2 (Figs. 22-24).
Day 1 strongly resembles the overall average of six flights. This is not surprising since it has twice as
much data as day 2 and so dominates the overall average. However, flight 4 (analyzed with flight 6 above) varies
drastically from the other three flights on day 1 with extraordinarily good performance a low speeds.
This props up day 1 in the standings. The lack of scatter and the high altitudes at which those data were
taken argue for their authenticity.
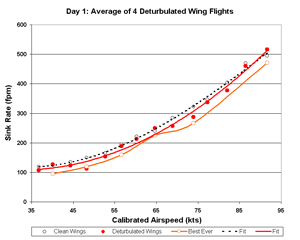 Figure 19. Day 1 Sink Rate
|
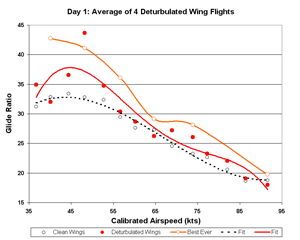 Figure 20. Day 1 Glide Ratio
|
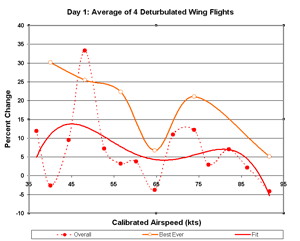 Figure 21. Day 1 Percent Change
|
Day 2 differs considerably from day 1. (We aren't surprised, are we?)
The most striking feature is the 50 to 70 kt points which follow
our best two prior flights very closely. Do these data corroborate our flights?
Well, it's two flights in Caddo Mills, one flown by Dick Johnson and the other by Jeff Baird vs.
two flights flown by me in Cherry Valley, Arkansas on separate, but similar, days. That's four flights
all together.
Also, the trend from 65 kts down to 50 kts suggests strongly that the 50 kt point is real and should not be
written off too quickly. Four of the six data sets attest to a strong 50 point. The strongest 50 kt point
was discarded from flight 3 (Fig. 3a), as was an opposing point from flight 2 (Fig. 2a). The reality of
the 50 kt best L/D point should be accepted even though a 4th order polynomial fails to reach it.
We should not be surprised by a shapely (feature rich) performance curve when measuring a subtle flow control method
that is not yet optimized. One should not expect a wing that successfully employes a dynamic flow control
method to produce a standard, well behaved polar like a purely rigid wing. Certainly not in the early
days (years?) of development.
For these reasons, and because of accumulating data, I believe this 50 kt (best L/D) point
to be real and solid. Last year, prototype 1 clobbered this point with a dip in the L/D
that this year (prototype 2) occurs around 70 kts.
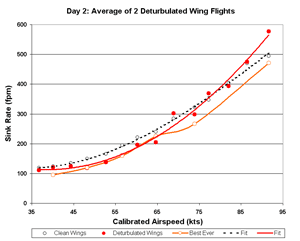 Figure 22. Day 2 Sink Rate
|
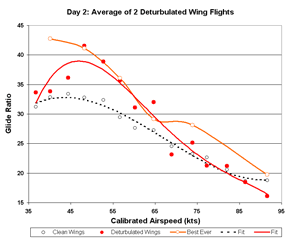 Figure 23. Day 2 Glide Ratio
|
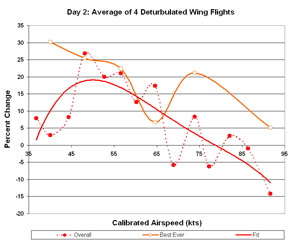 Figure 24. Day 2 Percent Change
|
Observations
Perhaps it is enough simply to walk away with an image of Fig. 25 burned in your memory. The green and
blue curves show the glide ratios measured on day 1 (four flights) and day 2 (two flights) respectively.
The orange is our best two, nearly identical, flights taken in ideal conditions in September and October
before the Caddo Mills tests.
Do the Caddo Mills measurements corroborate the our measurements? Considering that the deturbulator design
is not yet stable over changes of temperature, humidity and rapid altitude changes, we did not expect the results
to match ours. Five features stand out in fig. 25:
- All eight flights converge around 42:1 at 50 kts (ISA).
- Day 2 at Caddo Mills follows our data very closely from 50 kts to 65 kts.
- Day 1 at Caddo Mills follows the baseline from 60 to 70 kts, corresponding to the dip in our measurements.
- Day 1 at Caddo Mills follows beneath our high speed points.
- There is a major point of disagreement at the low speed end.
The first four features offer convincing evidence that the Caddo Mills data, in piecemeal fashion,
confirm our measurements over all airspeeds except the lowest. In other words, when conditions were
(nearly) right at Caddo Mills the deturbulators were found to perform (nearly) the same as in our tests.
All of the differences can be explained in terms of the deficient vent design of the present
deturbulator prototype, as Dick Johnson suggested in his report with respect to high speed performance.
Both we and Dick Johnson took data from low to high speed, high to low altitude.
But, at Caddo Mills, they released between 12,000 and 13,000 feet, whereas we released
at 10,000 feet. Because of higher altitudes and greater humidity at Caddo Mills,
the pressure equalization vents lagged, causing the first measurements (35-45 kts) to
occur with the deturbulator skin loosened. Then, equalization occurred rapidly as the glider descended, and
the deturbulators worked well for the 50 kt run.
The vents were excessively restricted on day 1 (green) so performance rapidly fell off again as increased
pressure pushed down on the deturbulator skin.
By 60 kts, the skin was pressed down firmly on the substrate, removing all dynamic effects.
On day 2, however, venting kept up with the descent rate from 50 to 65 kts, allowing the performance
to follow our measurements that were taken under ideal conditions.
Then, after a curious transition, performance synchronized with day 1 for speeds over 75 kts.
Fig. 26 averages the two days. Since they produced such different results, this average
does not indicate performance that can be expected in any given flight, but a middle ground about
which the present deturbulator prototype performed at Caddo Mills. The orange
curves show perhaps the best that can be expected, at least the best measured to date. Remember
that the wide spacing between orange data points may hide structure in the data, perhaps like that
revealed in the Caddo Mills data. Those variations are better understood now and the pathway to more
normal performance appears to be clear.
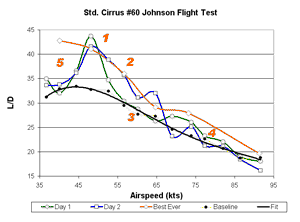 Figure 25. Days 1 and 2 and Best Ever Glide Ratio
|
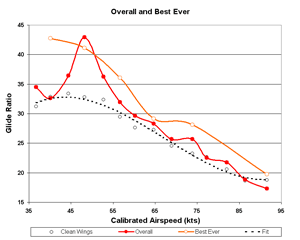 Figure 26. Overall and Best Ever Glide Ratio
|
Flight Test Logs
Following are log files for two flights in Arkansas, before taking the glider to Johnson, and for the six Johnson flights.
These are paresented for anyone caring to examine the log data for themselves.
| File |
Date |
Place |
Flight # |
Pilot |
Comments |
| 69RC3R21.IGC |
9/27/2006 |
Cherry Valley, Arkansas |
1 |
Hendrix |
Notches in the altitude data separate the speeds (40, 50, 60, 70, 80, 100, 110 kts IAS).
The measurements begin in the second segment.
|
| 6ALC3R21.IGC |
10/21/2006 |
Cherry Valley, Arkansas |
2 |
Hendrix |
Notches in the altitude data separate the speeds (40, 50, 60, 70, 80, 100, 110 kts IAS).
|
| 6CDC3R21.IGC |
12/13/2006 |
Caddo Mills, Texas |
1 |
Johnson |
35-100 kts IAS, in 5 kt steps. Additional low-altitude points for 40 & 45 kts. |
| 6CDC3R22.IGC |
12/13/2006 |
Caddo Mills, Texas |
2 & 3 |
Baird & Johnson |
35-100 kts IAS, in 5 kt steps. Additional low-altitude points for 40, 45 & 50 kts.
Flight #3 Extreme Performance! |
| 6CDC3R23.IGC |
12/13/2006 |
Caddo Mills, Texas |
4 |
Baird |
35-100 kts IAS, in 5 kt steps. Additional low-altitude points for 40, 45 & 50 kts in flight 4 only.
Flight #4 Extreme Performance! |
| 6CEC3R21.IGC |
12/14/2006 |
Caddo Mills, Texas |
5 |
Johnson |
35-100 kts IAS, in 5 kt steps. Additional low-altitude points for 45, 50 & 55 kts. |
| 6CEC3R22.IGC |
12/14/2006 |
Caddo Mills, Texas |
6 |
Baird |
35-100 kts IAS, in 5 kt steps. Additional low-altitude points for 80, 70, 60, 55 and 50 kts. |
Following is Johnson's data from his historic flight #3, the first ever measurement of extreme performance!
This flight was replicated one year later
(Johnson Effect Confirmed)
to confirm that it is both real and repeatable. The pressure altitudes in this data may be used to isolate data in the logs above that correspond
to Johnson's tested airspeeds.

Following is Johnson's data from flight #4, flown by Jeff Baird, the second measurement of extreme performance!

Appreciation
Our thanks to Dick Johnson for conducting these tests, Jeff Baird for sharing the piloting duties,
tow pilots David Cheek and Howard Hughes, Paula Lara and her staff at
Southwest Soaring, Inc. and
the Dallas Glider Association (DGA) for funding these flight tests.
Jim Hendrix
Oxford Aero Equipment
|