|
|
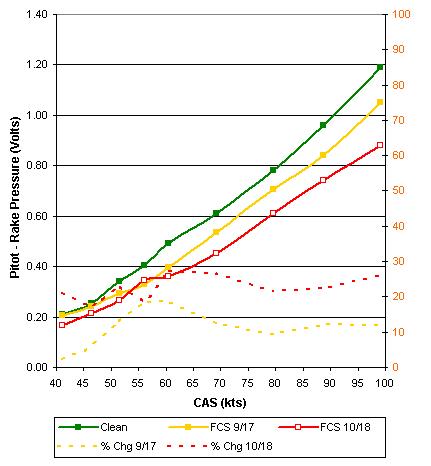
Further drag reductions on Standard Cirrus wing (10/18/2003)
Aside from the stunning high speed reductions, the low speed improvement essentially leveled the performance boost across the entire range of airspeeds! The points of greatest improvement were 27.3% at 60 kts, 26.7 at 70 kts and 26.2% at 100 kts where the trend was upward. Vne for this ship is 119 kts. The average for speeds over 50 kts was 23.7%. The second positive outcome was that, for the first time, we had substantial success on the suction side of the wing. This was the sixth attempt on the upper surface. The previous three tries produced incremental but small improvements. The fifth attempt gave an encouraging 20% improvement at 100 kts, but fell off sharply to nothing at 80 kts and produced moderate drag increases at lower speeds. Since we use the drag rake on only one surface at a time, we had the upper pitot openings taped over for this flight. However oil flows showed that the distinct upper surface separation bubble was mostly eliminated. Only a few localized spots of weak bubble activity remained. We intend to take drag rake data for the suction side on the next flight test. Improvements on the top surface are not expected to be as dramatic. If this holds true, it will be a shame because clean wing measurements indicate that the suction side produces more drag than the pressure side, three times as much at 40 kts, two times at 50 kts and 1.5 times at high speeds. The reader will be excused for viewing this in disbelief. Time will tell.
Jim Hendrix |
Airspeeds shown in graphs are instrument calibrated. The aircraft airspeed system is not calibrated. Errors in the Standard Cirrus static/Pitot system bias the data towards higher speeds. This makes polars seem better than they really are. However, this is not an issue when the purpose is only to show comparitive data on the same glider.
| © Copyright 2003-2012 Jim Hendrix | Disclaimer |