Drag measurement instrumentation
|
Figure 1. Dick Johnson's Improved Drag Rake
Design.
|
In the summer of 2003, Dr. Sinha engaged Oxford Aero Equipment
(OxAero) to
began test flights, with a Schempp-Hirth Standard Cirrus glider.
Initial testing verified the operation of the drag rake to be used in future tests.
Fig. 1 is a drawing by Dick Johnson for his improved drag rake as described in his article
Flight Test Evaluation of the
Grob 103C Twin III glider,
Soaring Magazine, March 1990. Fig. 2 is a close-up of a drag rake
built from Dick's drawing, the first one used in these tests.
|
|
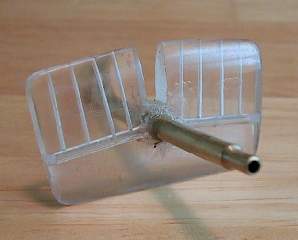
Figure 2. First Drag Rake for Testing.
|
This drag rake was intended for placement at the 53" span station (two ft inboard of the
airbrake) where the wing chord (c) is 32". The drawing specifies a center-to-center spacing of
0.005c between Pitot holes, so that the outermost hole falls is about 0.02c from the wing surface.
The idea is for the drag rake to average the airspeed at four distances from the wing surfaces within
the boundary layer.
For the Standard Cirrus wing at the 53" station, the Pitot hole
separation should be 0.163" and the outermost hole should be 0.652" from the surface.
However, due to an error in calculation, the actual drag rake was given 0.125" between holes,
placing the outermost hole 0.5" from the surface. This is not a
problem as long as comparative testing is done using the same drag rake.
With these dimensions, this rake is best suited for the 163" span station where the chord
length is 25".
|
|
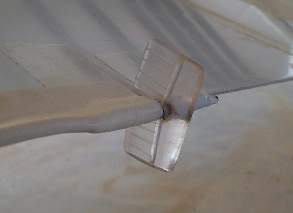
Figure 3. Drag Rake installed on trailing edge.
|
Fig. 3 shows the placement of this drag rake on the trailing edge of the right wing, at the 53" station.
The connecting tube is of tygon with an ID of 1/16". It is taped to the trailing edge of
the wing, under the wing root fillet and along the fuselage to an inspection hole under the wing.
Just inside the hole, the tube ID changes to 3/16" for connection to a pressure sensor.
|
|
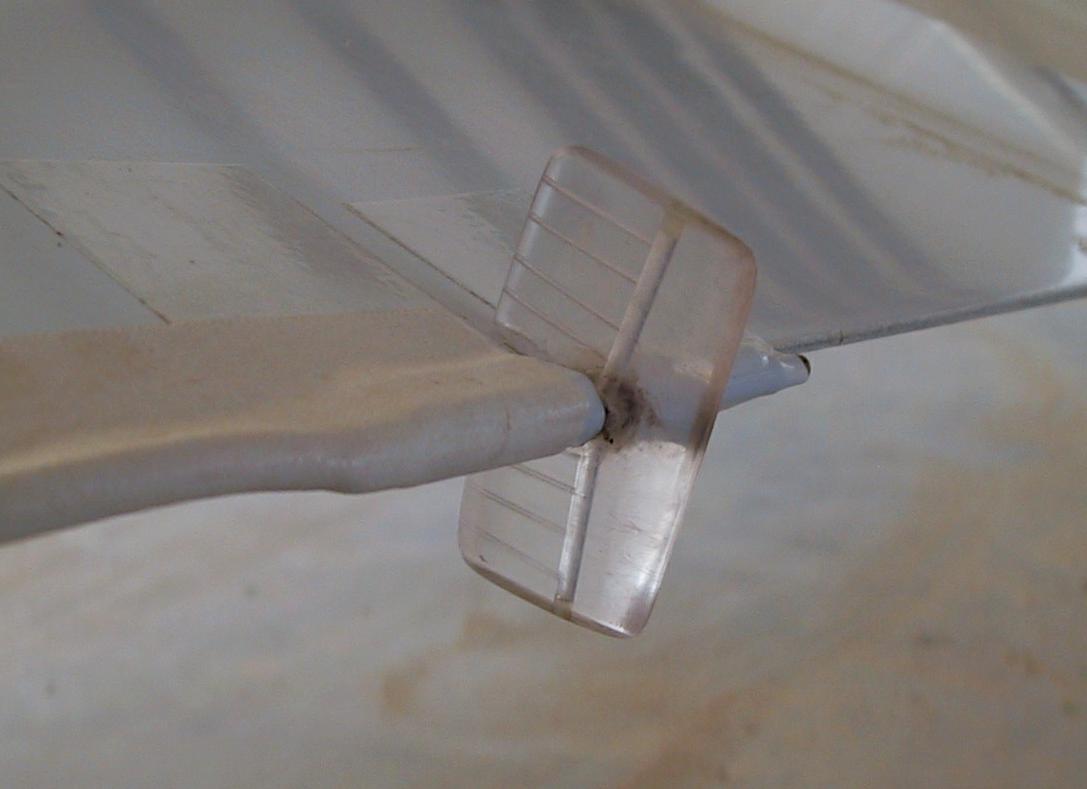
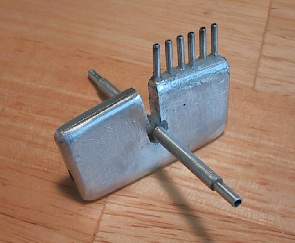
Figure 4. Second Drag Rake.
|
A second drag rake (Fig. 4) was constructed to correct the dimensional error. This one was constructed strictly
for measurements of a single wing surface. Dr. Althaus has
pointed out that, because of the spread in boundary layer velocities of the upper and lower sides of the wing,
the Johnson probe does not correctly indicate the combined profile drag from both surfaces. Since we wish
to evaluate only one surface at a time, we built this probe with Pitot openings on only one side.
The connection tube is open at both ends so the probe can be flipped over for use on the
other side. We plug the unused end. Following Althaus, this probe has Pitot
tubes extending in front of the device. This is supposed to give more reliable readings than flush openings.
However, tests with the first probe produced essentially perfectly repeatable results.
This probe reaches farther into the boundary layer than the first one and has six Pitot openings.
The center of the innermost opening is 0.06" from the surface, closer than first probe, and the
remaining openings are 0.12" apart. This gives this probe a reach of 0.66", 0.0206c at the 53"
span station. Outer Pitots can be blocked off for use farther out on the wing.
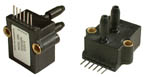
The pressure difference between the ASI Pitot and the drag rake is measured by a
Honeywell DC002NDR4
piezoresistive, differential pressure sensor (Fig. 5) with a range of ±2" H2O.
This device is amplified and temperature compensated, so as to give consistent voltage outputs with
wide variations of supply voltage and ambient temperature.
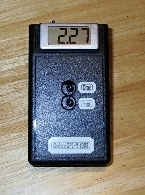
The sensor was mounted in a plastic project box (Fig. 6) with a 9V battery, a power switch and a miniature
multimeter for reading the sensor voltage. Holes were drilled into an instrument-hole blank to accommodate
the pneumatic connections and the two mounting screws (Fig. 6) to hold the device onto the blank. Fig. 9
shows the finished installation.
|
Figure 5. Honeywell DC002NDR4
pressure sensor.
|
|
Figure 6. Pressure sensor in
project box with 9V battery
and digital voltmeter.
|
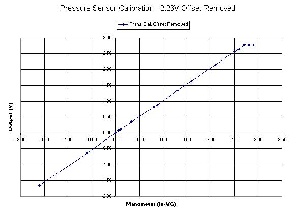
Honeywell specifies a linear 1 Volt excursion from a center voltage (typically 2.25V) for each inch H2O
of pressure difference. For this application, the main Pitot connects to the high pressure side of the sensor
and the drag rake connects to the low pressure side. Thus, we are interested only in positive pressure differentials,
voltages above 2.25V. This device was calibrated against an accurate manometer (Fig. 8) and found to be very close to
specifications with an actual center voltage of 2.26V. It can be seen in Fig. 8 that the sensor actually
operates up to
2.75V in the positive side. This corresponds to 65 kts, using the formula
Vkts = sqrt(water gauge in./0.000652).
Considering that we are measuring airspeed differences, not absolute airspeeds, this range is ample.
The typical total error of the DC002NDR4 is ±1.5% of full scale.
This corresponds to ±0.83 kts. For the range of differential airspeeds expected, 20-45 kts,
typical total errors will range from ±4% to ±2%. This is adequate for our purposes.
A flight test was run on 6/21/2003 to verify the functioning of the first drag rake and
the pressure sensor, and to see of how difficult it would be to hold constant airspeeds
while taking accurate readings of the pressure sensor display. The equipment worked
flawlessly, but holding the airspeed while noting the readouts proved to be quite
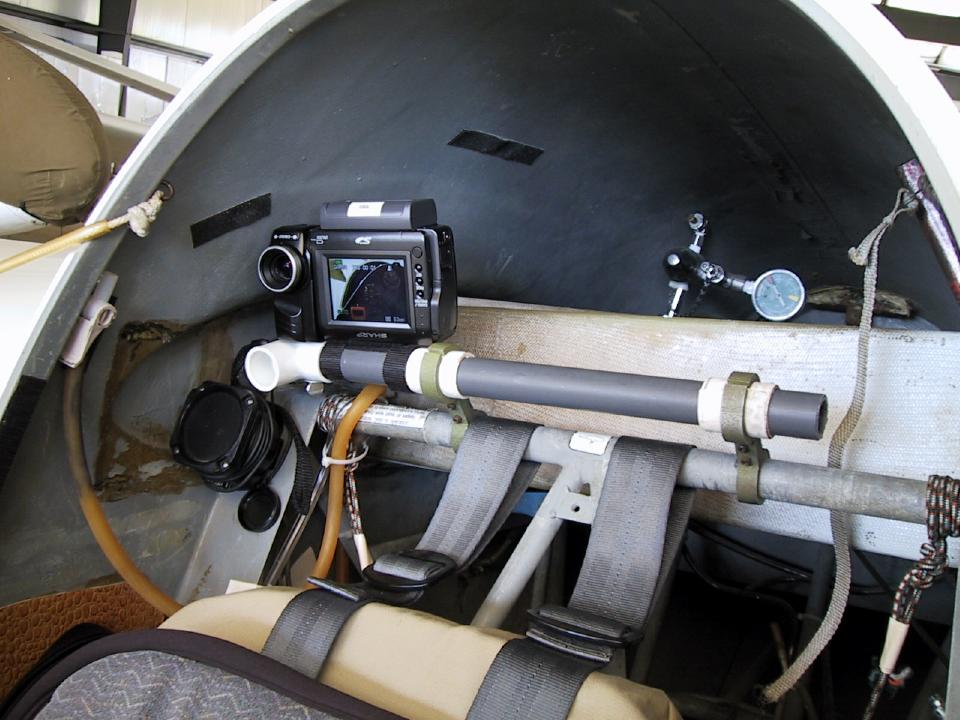
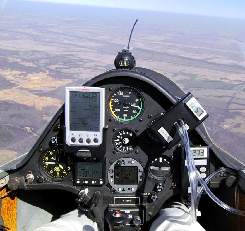
challenging. To improve this situation, a small video camera (Fig. 10) was mounted behind the
pilot's right shoulder to record the entire test sequence. Later, the video was transferred
to VHS tape for careful review and noting of the data points and for archival purposes.
This made it easier to match take pressure readings only when the ASI was dead on the target
airspeed and stable.
With practice, however, we found that eyeball readings taken in flight were very close to those
taken from the VHS tape. One advantage of using the video camera is that the L-NAV temperature
display can be recorded during the test sequence.
|
|
Figure 8. Pressure Sensor Calibration.
|
|
|
|
Figure 9. Two pressure-sensor voltage displays.
|
|

|
Figure 10. Video Camera Records Airspeed,
Drag Pressure and Temperature.
|
|
|