|
|
Measurements with Full Top Surface Deturbulation (3/19/2005)
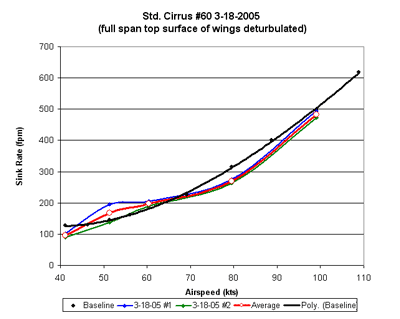
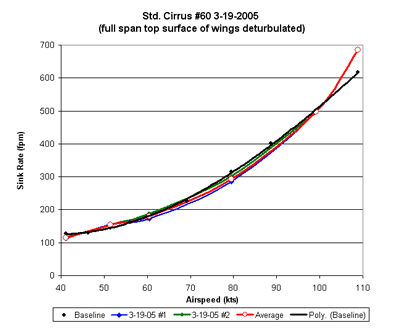
Three test flights have been flown with a full span, top side application of deturbulator on Standard Cirrus #60. The first flight, on March 12, was with high winds aloft and resulted in useless sink rate data. The second two flights were on March 18 and 19. Conditions were much better and on each day two sets of sink rate data were taken. As before, the purpose was not to measure an accurate polar, but to see generally what effect the top surface deturbulator was having before proceeding with the bottom side. The average of the four sink rate measurements is plotted in Figure 34. The separate flights are shown in Figures 35 and 36. Except for the 50 kt point on 3/18, the two measurements each day agree very closely, although the curves each day differ. Since prior drag measurements have shown the top side deturbulator working consistently, we believe these differences are due to air mass movement. Averaging only two such different flights will not give a dependable polar. So, Figure 35 should not be taken as an accurate picture of the performance at this stage. Nevertheless, some features are emerging. First, I would note that the 50 kt point is not reliable because of the wide spread in the data at that speed on 3/18 (Figure 35). Considering the absence of a 50 kt hump on 2/26/2005, this feature seems to be an artifact of data scatter due to air movement. Next, note that compared to the partial span deturbulation 2/26/2005, the high speed baseline crossover point is now at a higher speed, around 105 kts. This is confirmed by all four measurements in this report. Also, at the low speed end, all four measurements are well below the baseline polar. More data are needed to nail down this value, but the average only 105 ft/min. This is not likely to be a good figure, but considering that the partial deturbulation (2/26/2005) also showed some improvement at 40 kts, it seems likely that we now have even more improvement. The 80 kt point in Figure 35 shows a reduction in sink rate of around 35 ft/min, or 11%. While this may not be a very accurate value, it is reasonable, considering that 60% deturbulation yielded an 8% improvement at this speed. Furthermore, the parallel flight with an ASW-28 yielded results that corroborates this measurement. In that case, the 18% higher sink rate of the Std. Cirrus relative to the ASW-28 at 80 kts appears to have been reduced to 6%, a decrease of 12%. This figure is very close to the 11% improvement measured in these two flights. One last observation. One data point was taken at 110 kts on 3/19. As expected it showed a bend above 100 kts toward higher sink rates. This appears to further confirm that the wing is flying with a negative adjustment to the angle of attack and this is exacting a penalty at very high speeds as separation occurs on the under side of the wing near the trailing edge. For what it's worth, this is also a feature of the ASW-28 polar, only in that case the bend occurs at 80 kts, not 100 kts. That makes me wonder what would have happened in the parallel flight if the speed had been 90 kts. One final note, the deturbulator is applied to the wings in about 12 segments on each side. There is a 1" gap between segments that is creating more drag than normal. This adds up to about two foot of span operating with more drag than the clean wing. We can eliminate half or more of this penalty to further improve the picture. The question is, do we do that now before moving to the lower surface, or do we accept what we have and move on?
Jim Hendrix |

|

|
| © Copyright 2003-2012 Jim Hendrix | Disclaimer |